Analytics
TAP gives you two analytics views: a Publisher Summary that rolls up all of your feeds, and a per-feed view for drilling into a single integration. Both are accessible from the Analytics item in the left navigation.
Publisher Summary
The Publisher Summary is the top-level view: total clicks, total earnings, average EPC (earnings per click), expired and stale clicks, and total jobs receiving clicks — across every feed under your account.
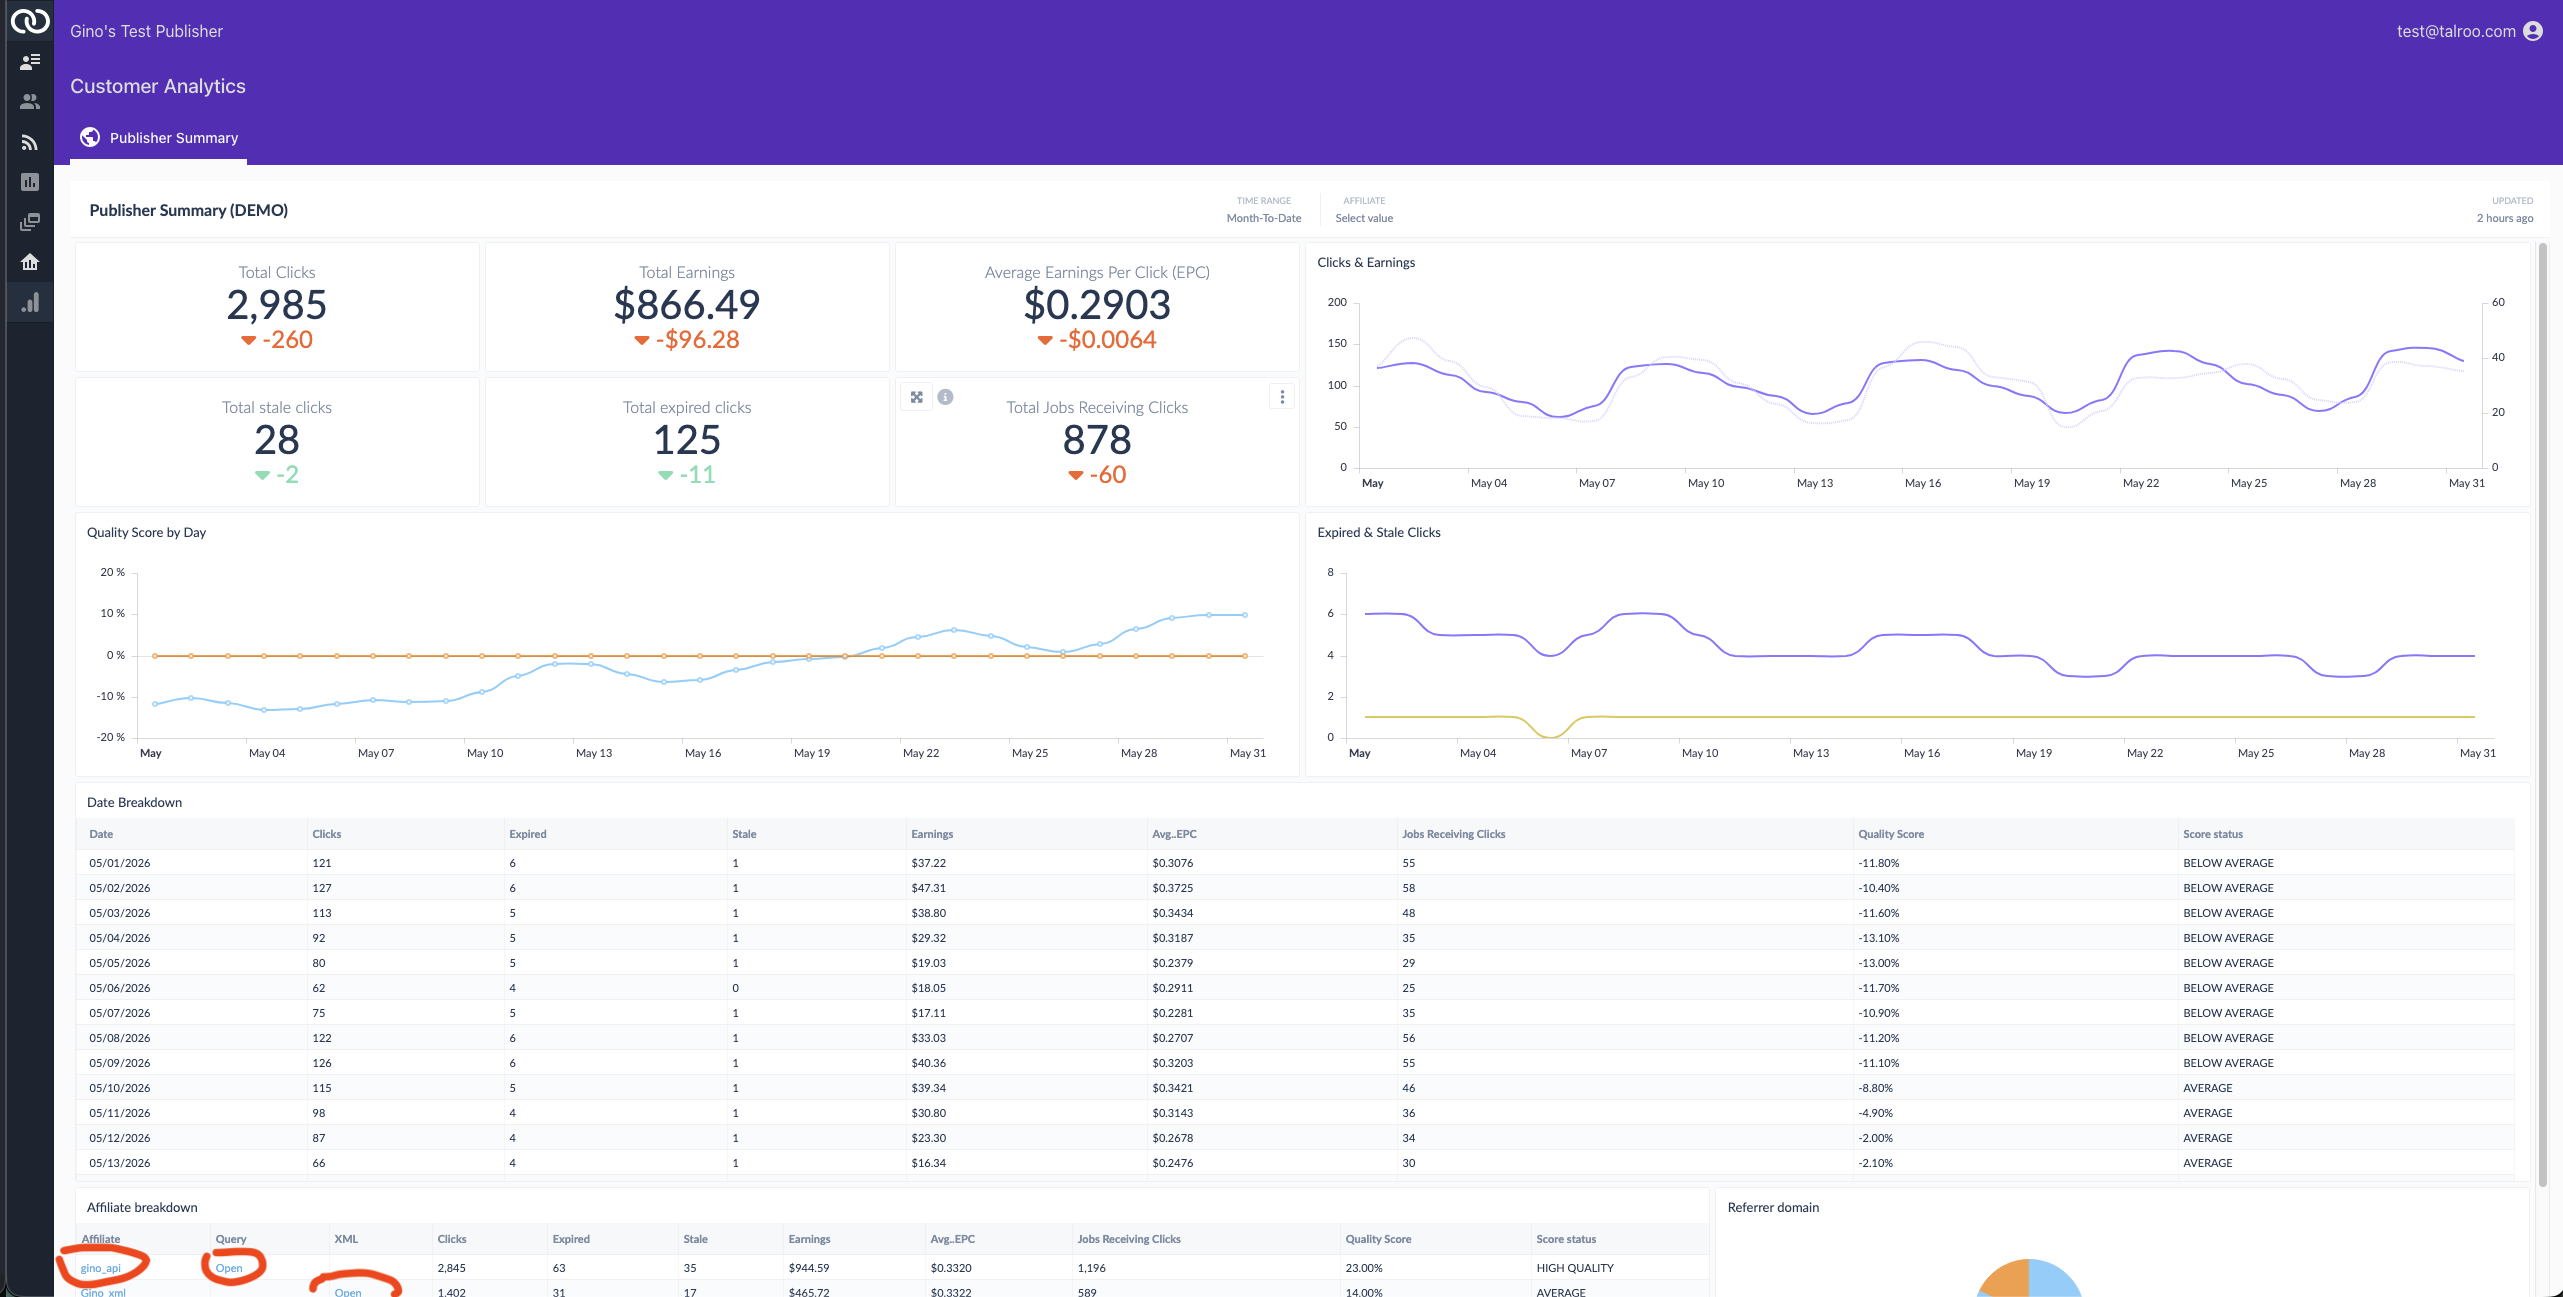
What's on the page:
| Section | What it shows |
|---|---|
| Top-line cards | Total Clicks, Total Earnings, Average EPC, Total stale clicks, Total expired clicks, Total Jobs Receiving Clicks. Each shows the delta vs. the previous time period. |
| Clicks & Earnings | Time-series chart of clicks (left axis) and earnings (right axis) over the selected window. |
| Quality Score by Day | Daily Quality Score trend vs. the network baseline (0%). See Quality Score. |
| Expired & Stale Clicks | Daily count of expired and stale clicks. See Click Validation. |
| Date Breakdown | Per-day table: clicks, expired, stale, earnings, avg EPC, jobs receiving clicks, Quality Score, and a status label (e.g. BELOW AVERAGE, AVERAGE, HIGH QUALITY). |
| Affiliate Breakdown | Same metrics broken down by affiliate ID, query, and (for XML) feed. Useful for spotting which sub-segments are pulling the average up or down. You can click on the links to see more information about each affiliate. If you want to return to the main dash after viewing affiliate details, click the back arrow at the top of the analytics. |
| Referrer domain | Pie chart of clicks by the referrer value you pass on Search API requests and outbound job click URLs — see Referrer. |
| Time range / filters | Top-right controls let you change the window (Month-to-Date by default) and filter by affiliate. |
Per-Feed Analytics
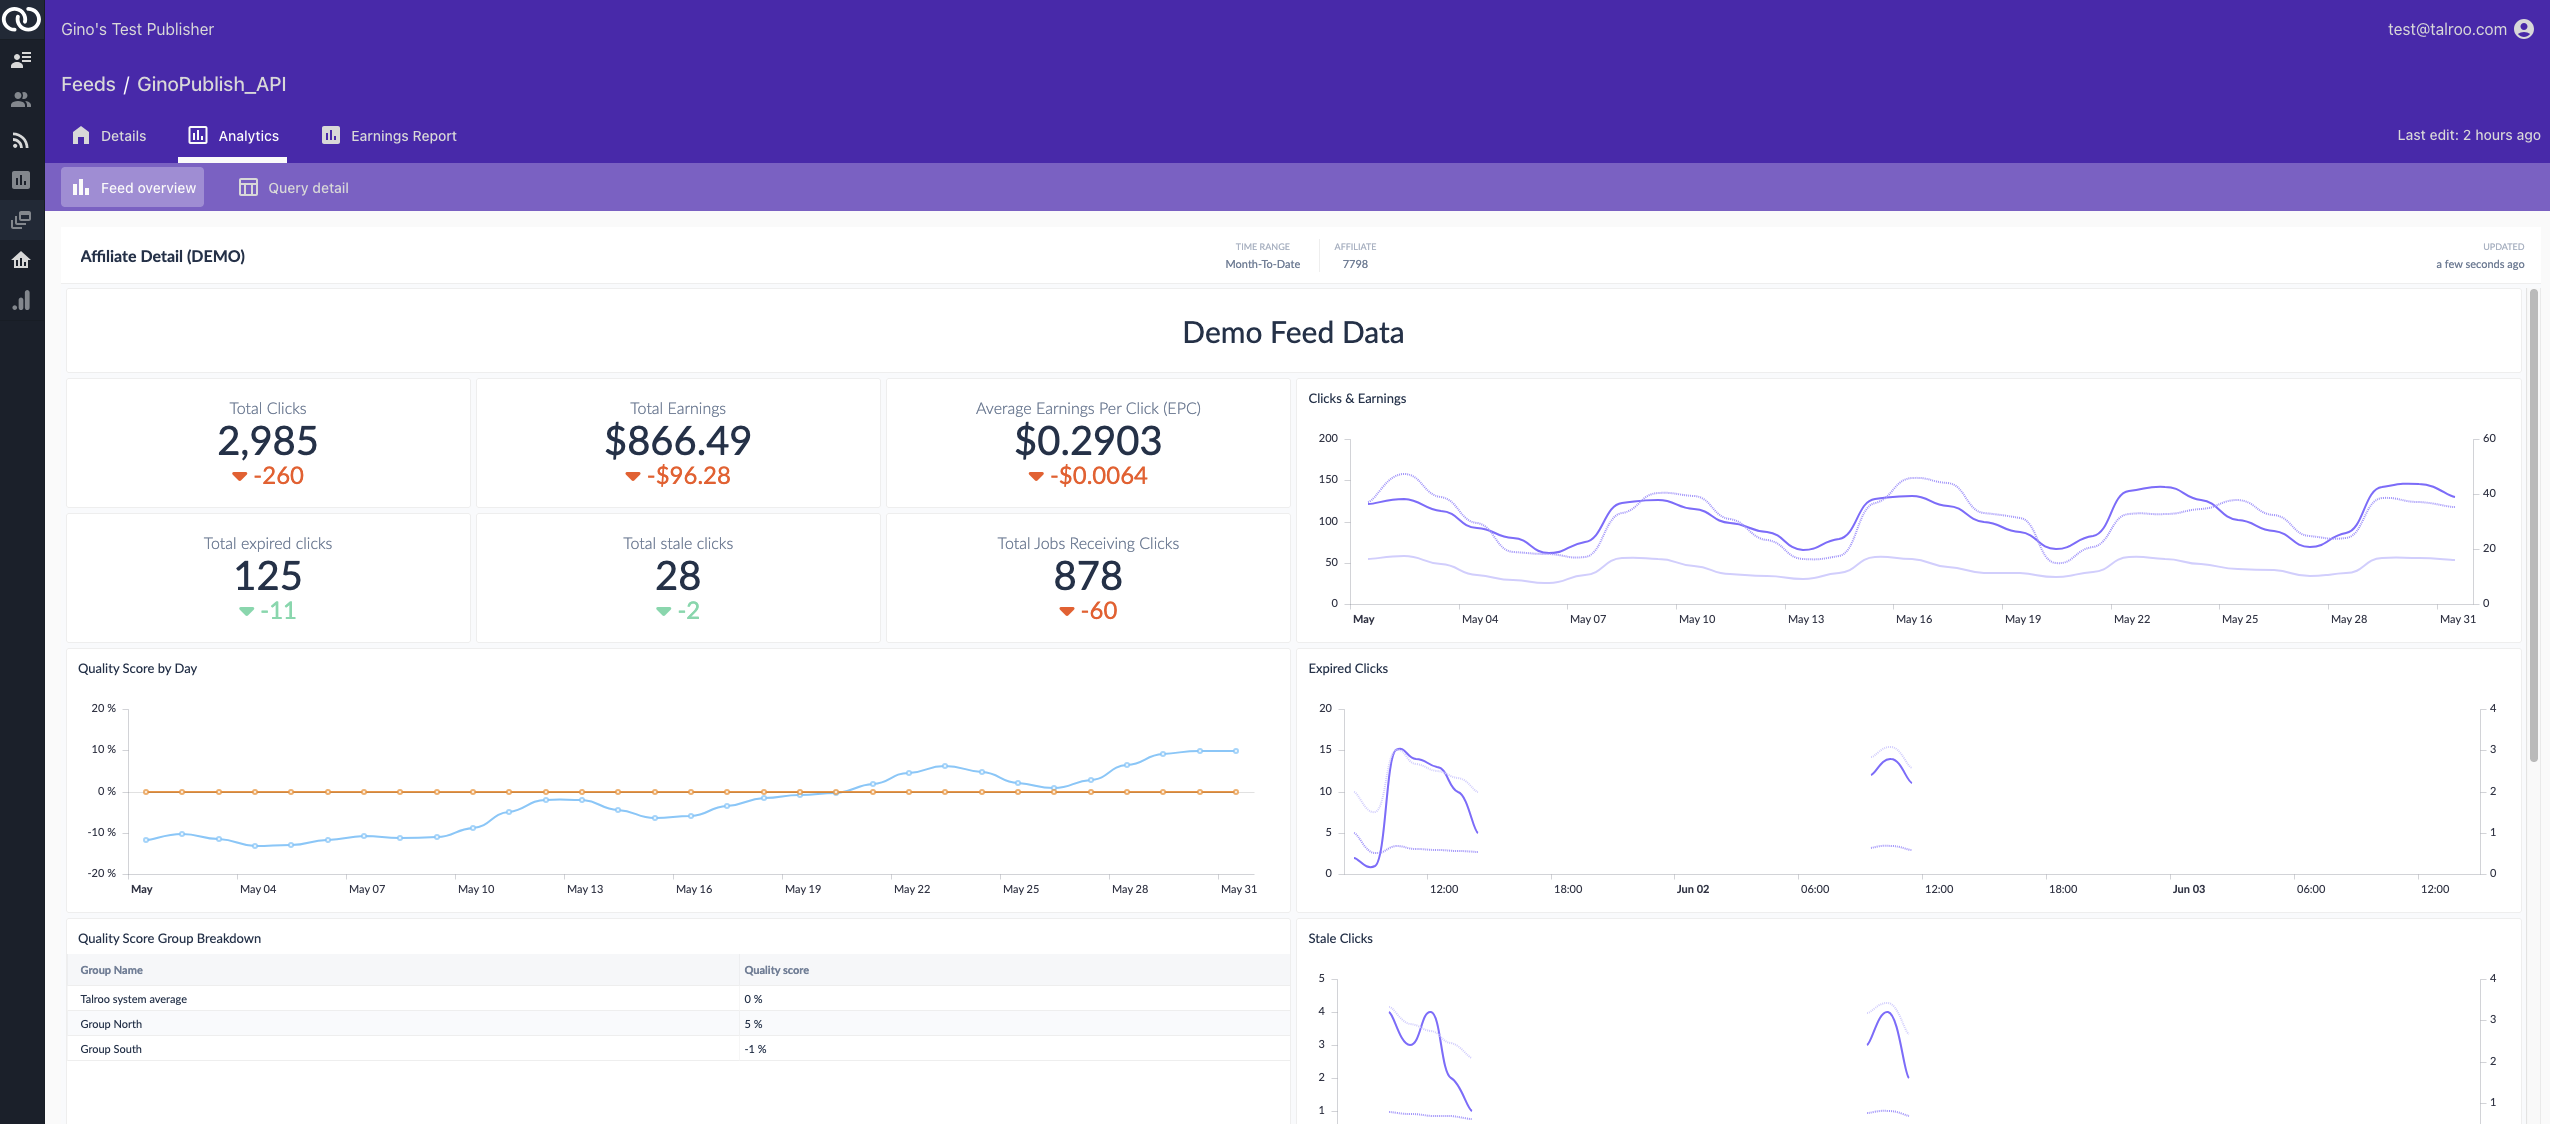
Click into a feed from the Feeds list (or open one and switch to the Analytics tab) to see the same metrics scoped to a single integration. This page has two sub-tabs that you can switch between. API feeds show Feed overview and Query detail; XML feeds show Feed overview and XML detail.
Feed overview
The same metrics as the Publisher Summary, but scoped to one feed.
What's different from the Publisher Summary:
| Section | What it shows |
|---|---|
| Quality Score Group Breakdown | your CURRENT Quality Score per group (e.g. by region or sub-feed) compared to the Talroo system average |
| Separate Expired and Stale Click charts | easier to diagnose which one is hurting payout. Contains median and max age stats for each click period to help diagnose issues. |
| Location Map | See Visually where your clicks are going in the US |
| Clicks by Day | See click counts by day of week |
| Clicks by Hour | See click counts by hour of the day |
| Clicks by Device | See click counts by mobile vs desktop traffic |
| Location Breakdown | Click counts by US city |
| Category Breakdown | Click counts by job industry |
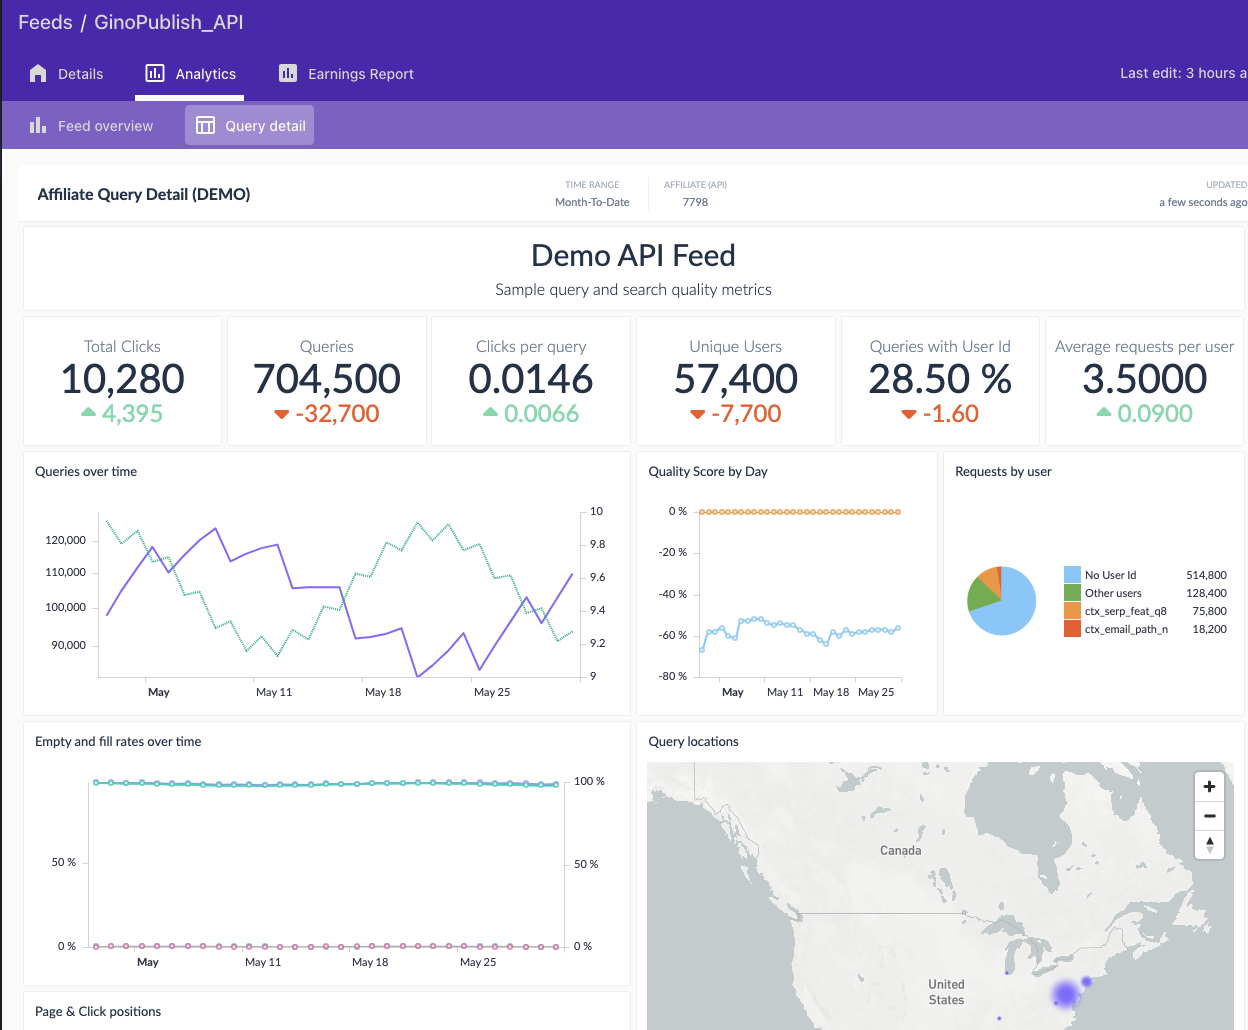
Query detail (API feeds)
For API feeds, the Query detail tab focuses on what users are actually searching for and how those queries perform.
| Section | What it shows |
|---|---|
| Top-line cards | Total Clicks, Queries, Clicks per query, Unique Users, Queries with User Id (% of queries that included a pid), Average requests per user. Each card shows delta vs. the previous period. |
| Queries over time | Volume of queries you are requesting from the Talroo Api and the average result count per query. |
| Quality Score by Day | Daily Quality Score for this feed. See Quality Score. |
| Requests by user | Details on how many requests are using user information, requests per user, and whether you have a few programmatic "users" via the pie chart. Read More |
| Empty and fill rates over time | What share of queries returned jobs vs. came back empty. A rising empty rate could be due to content issues with low Quality Score. |
| Query locations | Geographic heatmap of where queries are coming from. |
| Page & Click positions | Distribution of which page and which slot on the page generated the click. |
| Top Query Keywords & Locations | Lists of most frequent queries and query locations from your requests |
If this number is low, you're leaving personalization revenue on the table. See Personalization (PID).
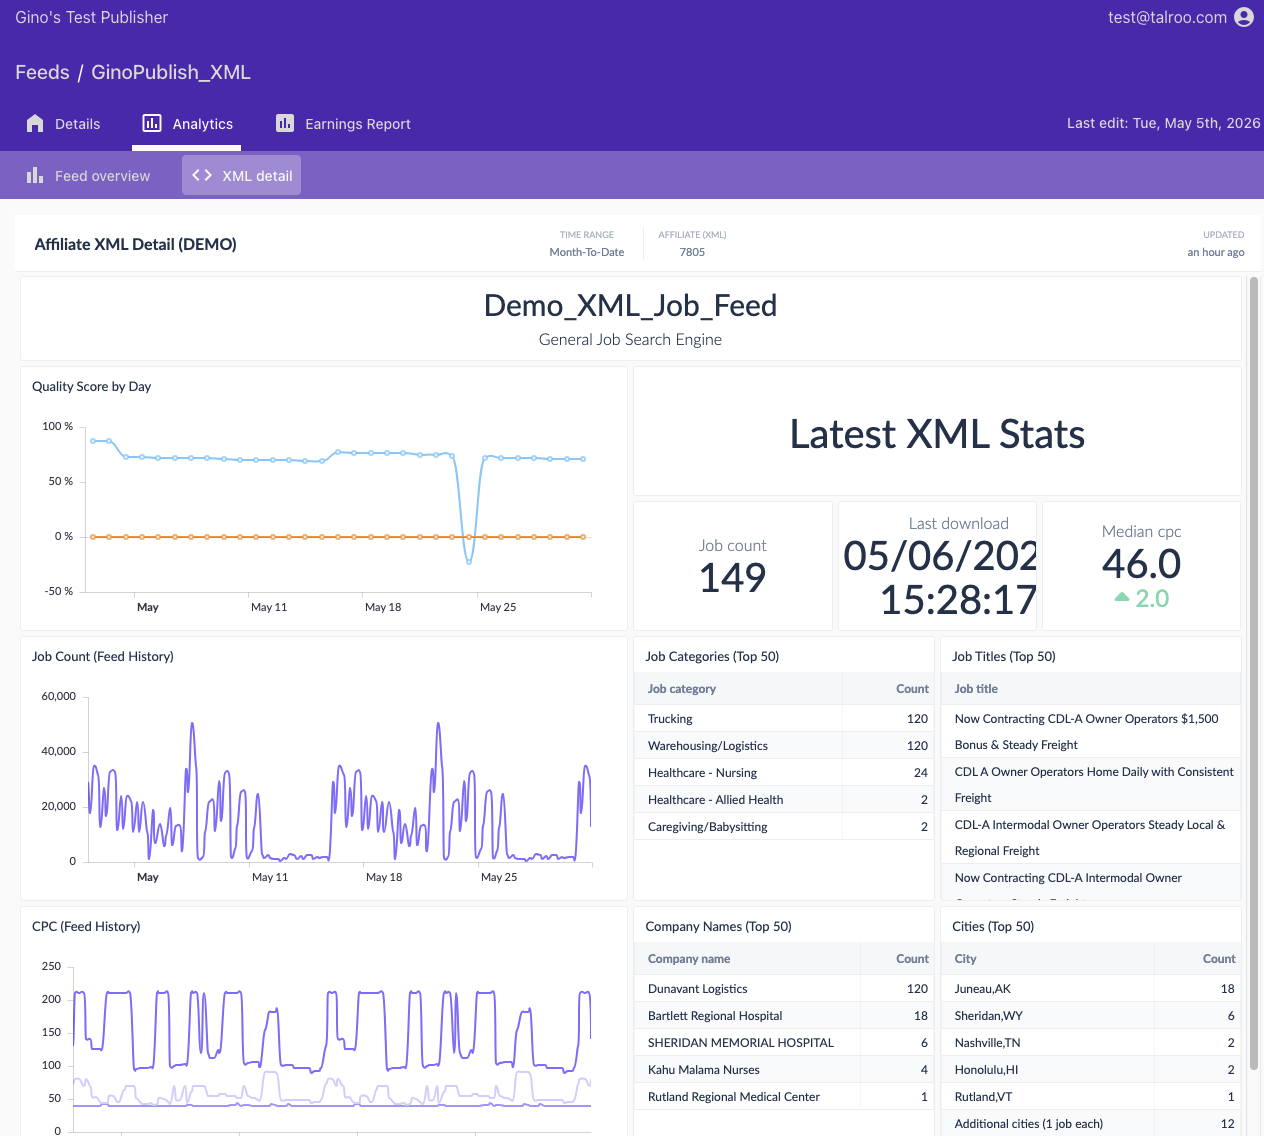
XML detail (XML feeds)
For XML feeds, the XML detail tab focuses on what's in the latest feed and how its inventory has changed over time.
| Section | What it shows |
|---|---|
| Quality Score by Day | Daily Quality Score for this feed vs. the network baseline. |
| Latest XML Stats | Snapshot of the most recent feed generation: Job count, Last download timestamp, Median CPC, and the Top 50 lists |
| Job Categories (Top 50) | The most-represented categories in the current feed. |
| Job Titles (Top 50) | Most common job titles in the current feed. |
| Company Names (Top 50) | Most common companies in the current feed. |
| Cities (Top 50) | Most-represented cities in the current feed. |
| Job Count (Feed History) | Time series of how many jobs each feed generation contained. Big swings can indicate filter, supply changes, or quality changes. |
| CPC (Feed History) | Time series of CPC over time. Includes Min, Max, and Median CPC useful for spotting pricing shifts in your inventory. |
| Feed Download Times | List of times that your system downloaded the feed. Can be used to spot misconfiguration of your frequencies or not downloading each feed part. |
| Click Breakdown by Generation | Click count list by the feed generation time and the timestamp of the last click. Can be used to see trends in your imports or whether a job wasn't taken down soon enough if the generation time is more than 24 hours older than the last click time See Stale Clicks |
If your Earnings or EPC is dropping, start in the Publisher Summary to see whether the issue is one feed or all of them. Then drill into the affected feed and pick the right detail tab — Query detail for API feeds, XML detail for XML feeds — to see whether it's a Quality Score, expired-click, query-mix, or inventory issue.
Related
- Quality Score — what the score measures and how to recover from a low one
- Click Validation — valid clicks, expired and stale attribution, and payout impact
- Revenue Models — what's driving the EPC number you see here
- Earnings Report — daily payouts table with Details downloads (
t1,t2,t3when tagged upstream) - Feed Configuration — adjust filters that affect what the analytics measure